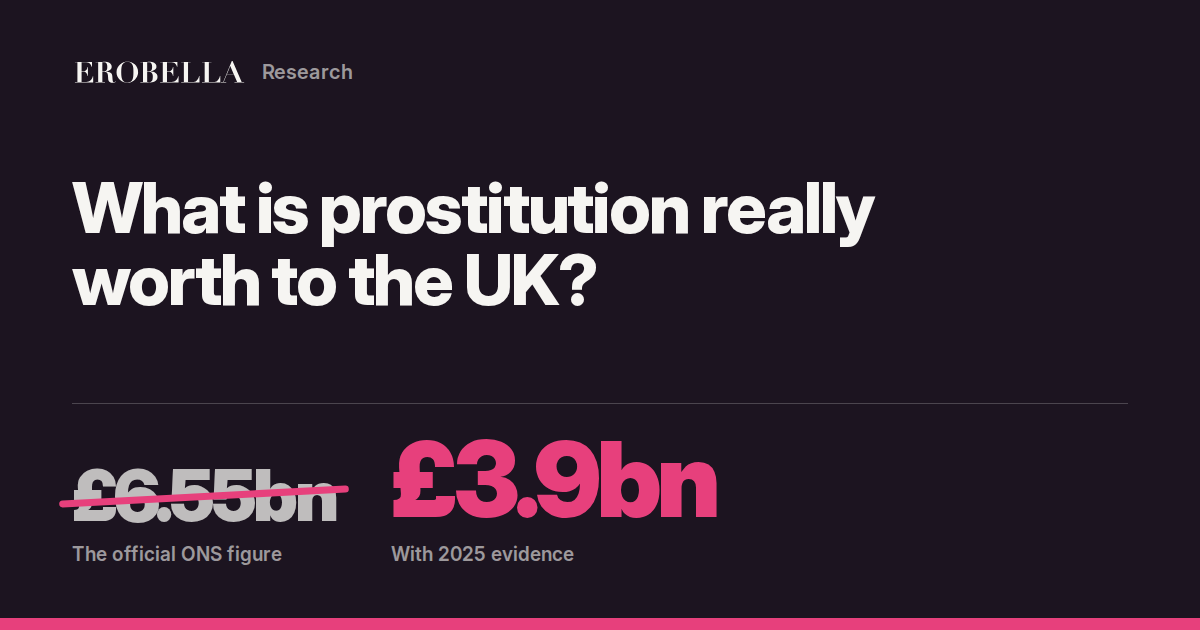
The official figure is £6.5 billion a year. It comes from a single sum, and most of its numbers date from 2004. We redid the sum with what sex workers told us and what they actually charge.
| ONS | New evidence | |
|---|---|---|
| Sex workers | 68,500 | 102,000 |
| Clients a week | 25 | 9 |
| Weeks a year | 40 | 40 |
| Price a visit | £96 | £105 |
| A year | £6.55bn | £3.9bn |
The ONS added prostitution to the UK's national accounts in 2014, when EU rules made every member state count it. It sits in the household spending tables, between hairdressing and pet care. The ONS puts it at £6.55 billion for 2025. That's up 4.1% on 2024 and more than three times the 1997 figure.
The figure comes from a model, so it only moves when the model's inputs move. Those are the number of men in the UK and a price index. Take out inflation and 2025 was a fraction below 2019. The exception is 2020, when the ONS cut the figure by 31% for lockdown and then let it recover. A method change in 2016 lowered the whole series, all the way back to 1997.
There's no survey behind the figure. The ONS multiplies four assumptions together. Each year it rolls the answer forward using the number of men in the UK and a price index for "personal services", the group that includes lap dancing and escort agencies.
A charity rang round adverts and counted about 7,000 sex workers working indoors in London. The police added 115 on the street. The ONS scaled that up to the whole UK.
Taken from a Dutch statistics paper. The ONS tested 20, 25 and 30 but never said which it used. 25 is the one that matches its published total.
Cut to 40 in 2016 to allow for 12 weeks' holiday, a figure borrowed from Dutch statisticians.
Taken from Punternet, a website where clients review sex workers. The ONS reference list cites Punternet's Wikipedia page.
Follow those numbers through and they say some odd things:
"This is a weak assumption based on the market for prostitutes' services."
ONS method paper, 29 May 2014, on growing the 2004 headcount in line with the male population
"The average person working in prostitution is turning over nearly £100,000 a year, which … is completely implausible. When better figures come out I predict the UK will be due a substantial rebate."
Sir David Spiegelhalter, statistician, University of Cambridge, October 2014
"At no point as a sex worker did I ever see twenty-five clients in one week, much less on 'average.'"
Brooke Magnanti, writer and former sex worker, The Baffler, June 2014
We kept the ONS formula and changed the inputs. We used a more accurate headcount, our own 2026 survey of how many bookings sex workers have, and the prices they advertise on Erobella.
From Erobella's 2025 study with Ronald Weitzer and others, which combines earlier estimates. Range 75,000 to 130,000. The ONS model implies about 68,500 today.
The average in Erobella's 2026 survey of sex workers. Those who do it full time reported about 12 a week, and those who do it now and then about 4.
We kept the ONS's 40 weeks. Our survey agrees: sex workers told us they work just over 40 weeks a year on average.
A typical hour on Erobella costs £140. A half-hour is £80, two hours £260 and a night about £1,000. We take three quarters of the hourly price to allow for shorter bookings, discounts, parlours and the street.
Our figure works out at £37,800 a year in takings for each sex worker. That's 36.7 million paid visits a year, about 706,000 a week. Takings aren't earnings. Parlours and agencies take a cut, and surveys of what sex workers earn come out lower, partly because cash income tends to be under-reported.
The ONS figure works out at £96,000 each, more than twice ours, and no survey of sex workers comes close to it. Nor does the £70,000 each in a 2015 model written for the ONS, which assumed full-time hours.
Like the ONS figure, this is what clients spend on in-person sexual services. It isn't what sex workers earn after costs.
It leaves out the legal adult industry, which GDP already counts elsewhere. That includes strip clubs, porn, webcams and sites like OnlyFans.
The headcount includes people who work part time or now and then, and so did our survey. Our range, 7 to 11 bookings a week, is the survey's margin of error.
The full method is in section 9. It includes Erobella's part in the headcount study.
£3.9 billion a year is nearly twice what Greggs takes in sales, and about what the BBC collects in licence fees. In the ONS's own spending tables, it puts prostitution below newspapers and domestic cleaners, and above illegal drugs. The fairest comparisons are the ones from that table, for the same year.
It's still big business. £3.9 billion is nearly four times the UK cinema box office, and more than NHS dentistry costs in England. The official figure tells a different story. At £6.55 billion, prostitution would be almost as big as the dentist or the vet, and about the same as Greggs, Wetherspoon and Netflix UK put together.
On 26 September 2026 Erobella had 30,014 live UK listings, and 8,603 of them show an hourly price. The typical price for an hour, where the client visits, is £140. Half of all prices fall between £120 and £160. If the sex worker travels, it's about £40 more. A half-hour costs £80, two hours £260 and a night £1,000.
These are asking prices on one site, mostly from people working for themselves. So they show the upper half of the market, not parlours or the street. They match the only academic study of a rival site, which found a typical hour cost £120 in 2018 and 2019. They also match Erobella's 2024 pricing study, which found an average of £162.
| Council area | Region | Live listings | Hour, incall | Hour, outcall | Half-hour |
|---|
Across the UK there are 43 live listings for every 100,000 people. London has 94. Wales has 23. The ONS ignores all this. It gives London 13% of the total, the same as its share of adult men.
If we share our £3.9 billion out by where listings are and what they charge, London accounts for £1.2 billion. That's 31% of the total. The North West follows with £418 million and the South East with £400 million. Scotland's share is £250 million and Wales's £103 million.
Over the past year, each London listing was viewed 104 times on average. In the South West it was 421 times. Scotland and the North East come next, at 361 and 334. Where there are fewer listings, each one gets looked at more.
| Region | Live listings | Per 100k | Hour, incall | Hour, outcall | Views per listing | Modelled value |
|---|---|---|---|---|---|---|
| London | 8,573 | 94.0 | £150 | £200 | 104 | £1,200m (31.1%) |
| South East | 3,301 | 34.1 | £130 | £170 | 204 | £400m (10.4%) |
| North West | 3,199 | 41.2 | £140 | £180 | 230 | £418m (10.8%) |
| West Midlands | 2,786 | 44.9 | £130 | £180 | 135 | £338m (8.8%) |
| East of England | 2,413 | 36.5 | £130 | £175 | 116 | £293m (7.6%) |
| Yorkshire and The Humber | 2,035 | 35.9 | £130 | £170 | 276 | £247m (6.4%) |
| South West | 1,946 | 32.9 | £135 | £180 | 421 | £245m (6.4%) |
| East Midlands | 1,818 | 35.7 | £120 | £160 | 232 | £204m (5.3%) |
| North East | 864 | 31.3 | £130 | £180 | 334 | £105m (2.7%) |
| Scotland | 1,913 | 34.5 | £140 | £200 | 361 | £250m (6.5%) |
| Wales | 735 | 23.1 | £150 | £170 | 316 | £103m (2.7%) |
Erobella's UK listings were viewed 8.2 million times in the year to 26 September 2026. The busiest hour is midnight to 1am, with 6.1% of all views. The quietest is 5am to 6am, with 1.8%. Just over a quarter of all views come between 10pm and 3am.
The day of the week hardly matters. Monday is the busiest, with 14.7% of views, and Thursday the quietest, with 13.9%. On this evidence it's a late-night habit, not a weekend one.
In 2014 every EU country was told to add prostitution to GDP. The UK did, and now records one of the highest shares in Europe. France refused to count street prostitution, saying coerced sex isn't a transaction. Germany said it was already counted, because sex work is legal there. The US, Canada and Australia leave it out.
| Country | Latest published figure | Share of GDP | How it's worked out |
|---|---|---|---|
| United Kingdom | £6.55bn spending in 2025. Value added was 0.35% of GDP in 2010 | 0.22% | ONS model: a 2004 count grown with the male population, 25 clients a week |
| Italy | €4.8bn spending and €4.1bn value added in 2023 | 0.19% | Istat: workers by type × services a day × days worked × price |
| Spain | 0.35% of GDP in 2010, about €3.8bn | 0.35% | INE, published once, in 2014 |
| Netherlands | €0.7bn value added in 2021 | 0.08% | CBS: licence records and advert counts, with prices per service |
| Ireland | 0.72% of GDP in 2013, for drugs, prostitution and smuggling together | n/a | CSO: no separate figure published |
| Poland | 0.04% of GDP, pimping only | 0.04% | GUS: selling sex is legal there, so it counts as part of the hidden economy |
| Sweden | SEK 520m value added in 2006 | 0.02% | SCB. It fell after Sweden banned buying sex in 1999 |
| Germany | No separate figure | n/a | Destatis: sex work is legal, so it was already in GDP |
| France | Street prostitution left out | n/a | INSEE: coerced sex isn't a transaction, so it isn't counted |
| United States | Not counted. The BEA says it would add about $10bn a year, as of 2017 | n/a | BEA working paper |
| Canada, Australia | Not counted | n/a | StatCan and the ABS leave out illegal activity |
In short, we took the ONS's own formula and swapped each 2004 input for new evidence, including our own survey of sex workers. The formula is workers × clients a week × weeks × price. Then we checked the result against what sex workers say they earn.
Workers. 102,000, from "Estimating the Total Number of Sex Workers in the United Kingdom" by Weitzer, Bennett, Jensen, Macioti, Yang, Kiki and Shave. It was published as a preprint in August 2025 and summarised on Erobella. It combines earlier estimates rather than making a new count, and gives a range of 75,000 to 130,000. It includes people who sell sex part time or now and then. Erobella's Head of Data & Research is one of the authors.
Clients a week. 9 in the central case, 7 in the low case and 11 in the high case. These come from "Your working week", an online survey Erobella ran from 7 to 9 October 2026. It asked: "In a typical week when you're working, how many bookings do you have?" 100 active sex workers answered. The mean was 9.1, the median 5 and the most common answer 4. The low and high cases are the survey's margin of error: a 95% range of 7.3 to 10.9 for the mean. On average, people said they work 40.6 weeks a year, so we kept the ONS's 40. Older surveys found lower numbers. In the NUM and University of Leeds survey of 240 sex workers in 2015, 76% saw 1 to 10 clients a week. In the Beyond the Gaze survey of 641 sex workers in 2016 and 2017, 54% spent 10 paid hours a week or less with clients.
Price per visit. £105 in all three cases, three quarters of the typical advertised hour. On 26 September 2026, Erobella's live UK listings gave a median of £140 for an hour, from 7,052 listings, £80 for a half-hour, from 6,108, £260 for two hours, from 3,567, and £1,000 for a night, from 2,509. No one records how long bookings last, so we take three quarters of the hourly price. That allows for half-hours, discounts, parlours and the street, while leaving room for longer bookings. A 2022 study by Yasseri, Sanders and others of 11,489 AdultWork profiles found a median of £120 an hour for women and £70 for men. A 2015 report for the ONS by Brooks-Gordon and others put street prices at £20 to £40. One blended price is a simplification, and asking prices aren't always what people pay.
Checks against the headcount study. The study says 73.5% of sex workers are women, 19.4% men, 3% trans and 4.1% non-binary, intersex or other. Weighting Erobella's median prices by those shares gives £133 for an hour and £75 for a half-hour. Add street work, which the study puts at 2% to 5% of the total, and a realistic mix of bookings comes to between about £100 and £130. So £105 sits at the cautious end. Charging every visit at the full hourly price of £140 would give £5.1 billion. The study also puts 35% to 40% of sex workers in London and the South East. Those two regions have 39.6% of Erobella's live listings.
Result. 102,000 × 9 × 40 × £105 = £3.9 billion. Low case: 102,000 × 7 × 40 × £105 = £3.0 billion. High case: 102,000 × 11 × 40 × £105 = £4.7 billion. These are spending figures, not value added. The ONS takes off a small amount for rent, clothes and condoms, which would lower both figures slightly.
The ONS model. Its inputs come from the ONS's May 2014 method paper by Abramsky and Drew, and its Blue Book 2016 revisions article. The 2025 figures we give for the ONS model are our own sums. We grew the 2004 headcount in line with the number of UK men aged 16 and over, from 23.3 million to 27.5 million. Then we found the price that makes 25 clients × 40 weeks add up to £6,546 million, the ONS figure for 2025.
Regions. We shared the central estimate out by each region's share of live listings, weighted by its median hourly price. Listings were matched to council areas and regions from their location using postcodes.io. Listings per 100,000 people use ONS mid-2025 population estimates.
These figures are totals from the 30,014 live UK listings on Erobella on 26 September 2026. We could place 29,966 of them on a map. No individual listing is identified.
Prices are asking prices, mostly from people working for themselves. We show a median only where at least 40 listings give a price, and we removed impossible values.
Views are counted per view, not per person, over the 12 months to 26 September 2026. The site grew over that year, so we only use views to show patterns within the year, not trends.
The survey was online, and we publish totals only. We removed 1 duplicate answer. Respondents reported about £2,300 a month from sex work on average, including online work, which is below the takings our model implies; takings include what parlours and agencies keep, and cash income tends to be under-reported. 56% said sex work was their main income, and they averaged 11.6 bookings a week, against 4 for the 17% who do it now and then.
The ONS hasn't been careless. Its 2014 paper is open about every gap. It calls its main assumption weak, and says its prostitution figures are "definitely weaker" than the rest of the accounts. But its inputs are 20 years old, and better evidence now exists. That evidence gives an answer 41% lower. The ONS's September 2026 revisions, which match this year's Blue Book, trimmed its 2025 figure by 1.6%. That doesn't change the picture.
This doesn't measure coercion or trafficking. By convention, national accounts only count deals both sides agree to, and so does our model. Erobella publishes separate research on sex workers' safety and wellbeing.
You're free to publish all findings, charts and tables. Please credit Erobella and, online, link to this page. The data is released under CC BY 4.0.
Press contact: Dara Weston, PR Manager, dara@erobella.com
Comment and interviews: Brenda Jensen, Head of Data & Research at Erobella
"The official figure isn't a measurement. It's four assumptions multiplied together, and three of them date from 2004. Put in what sex workers told us about their week, and the number falls by about two fifths."
Brenda Jensen, Head of Data & Research at Erobella
"That doesn't make it small. Nearly four billion pounds is almost twice what Greggs takes in a year. But the official figure counts every sex worker as if they saw a thousand clients a year. The people we asked see about 360."
Brenda Jensen
Also by Erobella Research: UK sex work statistics, the University Towns STI Index, Out on Campus, the Liberal Cities Index.